Apache vs. NGINX: Match of the Millennium
Dream match never ends
Here is the second article in the performance series we started last year, dealing with the old feud between Apache and NGINX.
As you may have heard of, we will soon publish a White Paper about PrestaShop’s performances, how to tune your shop, enhance its response time, and so on.
During these benchmarks, we did compare performances between Apache & NGINX, the usual contenders, with identical setups.
Though this article probably won’t end the long debate between those two, let’s hope it will help you find some clarity on the matter and find out which one is best suited for your configuration. If not both.
Ready to rumble?
As you’ll see, this article will be illustrated by screenshots from the 2D fighting game Garou Mark of the Wolves, belonging to SNK Corporation, as it features a fight between 2 popular webservers. Of course, there is no real fight there, as hinted by our article’s conclusion. Also, this is an hommage to the fighting games genre, at its height in the 90s, to Garou Mark of the Wolves specifically, one of the best ever released and the work of a company at the height of its savoir-faire.
Player Select
 Garou: Mark of the Wolves belongs to SNK Corporation
In the left corner, we have the Apache webserver, developed by the famous Apache Foundation under the Apache License, and coupled with php-fpm. By default, and design, Apache is fully synchronous, locking a thread (or process, depending on your configuration) for each incoming request.
In the right corner, we have the NGINX webserver, much more recent than Apache, either under a BSD-type license (or a commercial one) and coupled with php-fpm. By default, and design, NGINX has an asynchronous, non-blocking event-driven architecture, meaning it does not create new threads or processes for each connection.
In order to be fair, we have tested them with the exact same technical stack, the same scenario and the exact same constraints.
Here’s a quick reminder of our test parameters:
- We used PrestaShop version 1.7.6.3 (latest version available at the time) with the same php 7.2 configuration, in a docker environment
- Both hosted on a not too shabby GCP instance with 4vCPU, 15GB RAM and SSD disks
- Shops are both configured with 1000 products, 10 suppliers, 2 languages, 5 categories, 1000 orders and a database around 140Mb
- We ran the same gatling crawling scenario, each visitor opening 15 pages per session
- The target is to get the most visitors while remaining under 300ms (95th percentile)
Hence the following architecture has been used for our tests:
 The usual suspects
FIGHT!
 Garou: Mark of the Wolves belongs to SNK Corporation
So, we have launched our scenario on each environment and now the results are coming… Let’s have a look:
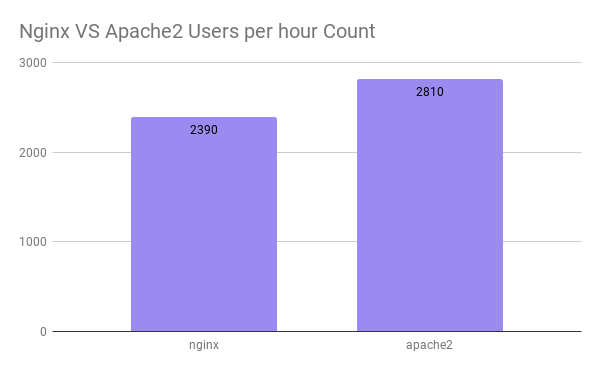 Of course, more users the merrier
Are those the results you were expecting?
Round 2!
Now, let’s see the data we gathered during those tests and check if anything odd appears.
First, the response time and the active users graph built with the Gatling scenario:
 NGINX active users are just below 100, around 94.
 Apache active users are above 100, around 110.
Nothing surprising about the active users, given the result we already had.
Also, looking at the servers metrics, we see that, for both of them, we have plenty of available memory:
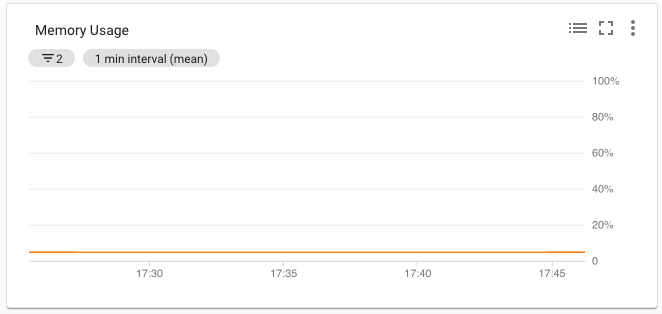 Memory usage, not even 10% consumed, we should be fine - excerpt from GCP monitoring
Same thing for network and disk IO, far from their limits for both instances:
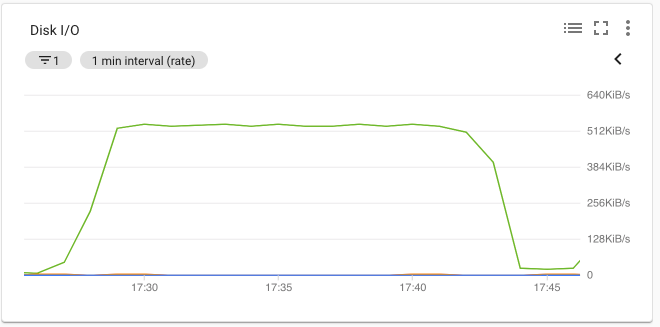 Nothing impressive here, especially for SSD disks - excerpt from GCP monitoring
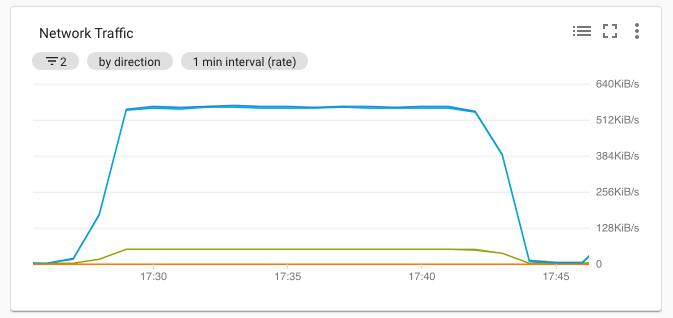 Network traffic, nothing specific, excerpt from GCP monitoring
More interesting is the CPU, that is almost completely used for both instances:
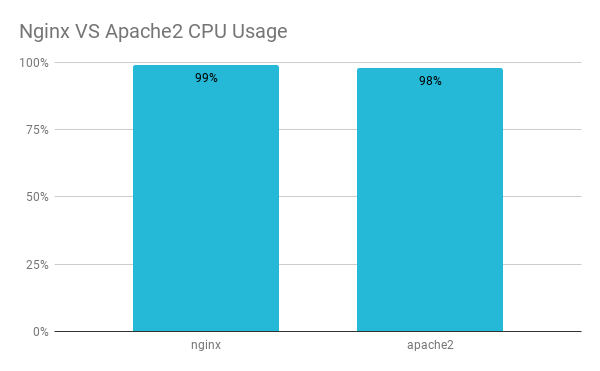
Some may say that looking at the CPU is not that much intesting, but others, such as us, may disagree.
If you remember our previous talk about performance, you may recall that performance tuning is about finding out the current bottleneck of a system. So, if our CPU is the bottleneck, then it is probably not the memory, the disk or even the network.
Also meaning that the CPU can do its part properly.
In our case, we can conclude there is not much constraint on the system preventing it from serving the application as expected - or at least that the constraints are similar enough.
Also, remember that our task here is to use as much ressources as possible and CPU time means it is not waiting for IOs (disk or network), or managing RAM (neither swapping, as it should be seen on disk), and so on.
K.O.!
So, now that we’ve seen that our system is all up to work at the CPU level, let’s try to understand what the Visitors result could mean to all the PrestaShops around the world.
As mentioned earlier, Apache and NGINX designs are very different, Apache using threads/processes for each request and NGINX using an asynchronous system (through an event loop) to manage requests.
Though NGINX’s asynchronous design lets it handle enormous charges and loads that Apache cannot, it has a tiny little drawback: latency. This latency, at least partially, is induced by the events management - it takes time to oversee several events at the “same time”, to check the different buffers statuses, and so on. Just like any other system, context switching and status management of its different parts does use resources. And more concurrent connections means more latency.
Where apache reduces latency to a minimum with its synchronous design.
It’s also worth mentioning that the induced latency is higher for dynamic contents (such as PHP) and very low for static contents (such as JPG, PNG, JS, CSS and so on).
So, even if apache can not handle as much requests as NGINX, it can (not always true, but it does happen) process them faster.
Given all that, we now understand that in our very narrow context, where processing dynamic content, and response time, are critical, NGINX is not the best suited.
Just in case you were wondering, achieving top performance could be done by serving static content through NGINX and dynamic ones through apache.
Continue?
 Garou: Mark of the Wolves belongs to SNK Corporation
Rest assured we are aware this benchmark is not an exhaustive one and plenty of parameters could have tiped the scale one way or the other.
Still, we do believe this test is relevant and could help understand which configurations are relevant to a given shop.
But don’t trust us blindly on this, we have provided you with the tools to perform your own benchmarks and even the capacity to enhance those tools to reach your own expectactions in different scenarios. Jut have a look and see what you can do with it.
Also worth mentioning is that, using the CPU up to 98% or 99% can be fine for a benchmark but it’s something you should never allow on a production server. Any additional load would slow down significantly the server and drastically increase the reponse time to a non acceptable threshold.
It is recommended to not go up to 40% a server usage (either cpu usage or load average) in order to deal with peaks and activity surges.
And that should be it for today.
Let us know in the comments if you found anything interesting in this article, if your own test concur with our own or if you have any question regarding this matter!
See you soon for the next article in the series.
About the series
These are the topics that have currently been covered during this series:
